Millions of Americans (including Barack Obama, apparently) attempted to binge-watch at least some of their way through the 13 hour-long episodes of the second season of Netflix’s hit political thriller House of Cards, which was released last weekend (a long holiday weekend in the US). Binge-watching is far from being a US-only phenomenon, as evidenced by the fact that the UK-based Oxford Dictionaries short-listed it for word of the year in 2013.
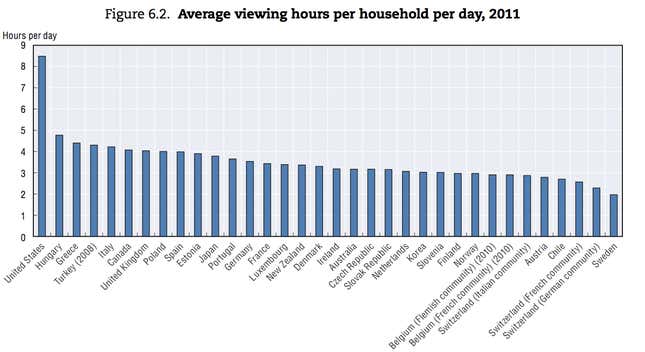
Yet according to the latest data from the OECD (from 2011, but released in July last year) the US is way ahead of the rest of the world in its TV addiction. The members of an average American household collectively watch more than eight hours of television a day, while the rest of the OCED ranges from two hours a day (Sweden) to just under five (Hungary).
How is such a wide gap possible? It can’t just be explained by differences in household sizes. In 2011, American households averaged 2.57 residents, while Australia (where a household watches a little over three hours a day) averaged 2.52, the UK (four hours) had 2.12, and Sweden had 1.99.
The OECD confirmed to Quartz that the US data, which were sourced from the Federal Communications Commission, are accurate. In its Communications Outlook ( p. 184) from which the above chart is taken, it acknowledged the data may reflect differences between “methodologies that have not been hamonized” but said that data “probably do provide a general indication of differences in consumption.”