-
YouTube's Monthly Time Per Viewer Has Been a Roller Coaster Ride
In my post last Tuesday, I cited comScore data showing that YouTube's share of online video views had dropped to 33.2% in Sept. '12, its lowest level in the 3+ years since I've been keeping track. On our weekly podcast last Friday, Colin Dixon from The Diffusion Group noted that while YouTube's view count was down, its time spent per viewer (sometimes referred to as "engagement") had increased during the past year.
Colin's point was consistent with YouTube's own goals; in response to my post, a YouTube spokesperson had directed me to a company blog post from August, in which Eric Meyerson, head of creator marketing communications, described changes the company had made to "encourage people to spend more time watching, interacting and sharing with the community."All of that prompted me to go back to the comScore data for the last 13 months to see how YouTube's minutes per viewer have changed during the period. Sure enough, there was an increase from 378 minutes per viewer in Sept. '11, to 419.1 minutes per viewer in Sept. '12, a 10.9% change (the increase of 41.1 minutes works out to about 1 1/3 more minutes of viewing per day).
But as the chart below shows, it has been a bit of a roller coaster ride for YouTube. Engagement climbed last Fall, then dipped in the winter, before increasing again through the July (peaking at 525 minutes), before dropping again through Sept. In fact, Sept. was just barely above February, which, at 418.2 minutes per viewer, was the lowest month of the period.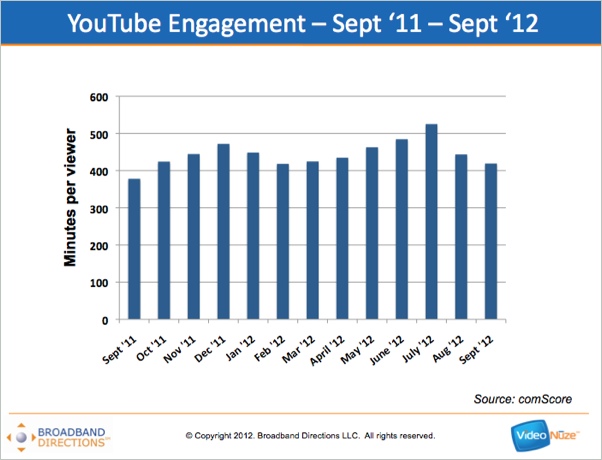
Putting YouTube's performance in context though, it was 1 of only 2 sites that increased its minutes per viewer over the past year. Microsoft was the other, with a 6.9% bump from 39.3 minutes to 42 (however, as I noted last week, Microsoft suffered a 49% decrease in number of viewers during the period, the largest drop for the 7 sites remaining in the top 10 from Sept. '11). All of the other 5 sites in the holdover top 7 saw a reduction in their minutes per viewer: VEVO (-35.7%), AOL (-29.5%), Viacom (-18%), Facebook (-15.5%) and Yahoo (-.6%).
Nonetheless, minutes per viewer for all sites comScore tracks actually increased from 1,167.9 in Sept. '11 to 1,399 in Sept. '12, a 19.8% rise. Combined with the reduction in total share for the top 10 sites from 57.5% to 42.4% that I noted last week, suggests that we're seeing not just fragmentation in viewing beyond the top 10, but also fragmentation in time spent.
All of this is important from my perspective because, as I've said many times, online video is mainly a free, ad-supported medium. Beyond the paid exceptions like Netflix, Amazon Prime, iTunes, etc., the vast majority of sites and viewing is sustained by ad dollars. And, as with all media, to drive those dollars, sites need both audience size and engagement (good old reach and frequency).
Keeping an eye on the monthly data helps inform all of us about which sites' revenues are likely benefiting the most and which ones are under pressure as the market continues to evolve.Categories: Aggregators

Connect with VideoNuze
Exclusive News Roundup
- YouTube Rolls Out Shopping Tools To Boost In-Stream Commerce Mediapost
- Quibi redux? Short drama apps saw record revenue in Q1 2024 TechCrunch
- Prime Video Advertising "Off To A Strong Start," Amazon CEO Andy Jassy Says Deadline
- Showtime Streaming Service Is Shutting Down at the End of April Variety
- Roblox Users Battle Tornadoes and Raise Pets. Will They Watch Ads, Too? WSJ
- Adobe Is Buying Videos for $3 Per Minute to Build AI Model Bloomberg

